What I Called, and What the Print Said
Q2 2026, reported 6 August. The first quarter with Legend inside the numbers.
The screener found the question. The business answered it.
GENI crossed below its 200-week line in February 2026 and stayed there. That is the entire contribution the screener made to this position: it put a name on a list. The 200-week line said the price had fallen below four years of its own average. The Bean Score said the free cash flow yield had pulled away from its own quarterly baseline. Neither of those facts is a reason to buy anything.
What made this a position was the work that came after: the NFL and NCAA exclusives running to 2030 and 2032, the camera arrays that competitors cannot replicate from outside the stadium, a customer list where Samsung graded the ad product Tier 1 and tripled spend, and a founder who had spent twenty-six years buying assets that made the existing platform more valuable. Cheapness identified the candidate. Execution justified the money.
I want that sequence on the record because the screener will hand me NKE and CMCSA and LULU below the same line, and those are different situations wearing the same badge. A stock crossing the line means the market has revised its opinion downward. Finding out whether the market is wrong takes reading the filings.
The scorecard
Every call from the 25 June piece, marked against the Q2 print. I have included the one I got wrong.
| Called on 25 June | Q2 outcome | Verdict |
|---|---|---|
| Margin expands from 23% to 28% on Legend | 26.9% in Q2, 258bps above the implied guide; FY guide raised to ~28.6% at midpoint | Hit |
| Legend worth $250-300M of revenue | Back-out implies ~$274M annualized | Hit |
| Betting compounds in the high 20s | +27.5% to $117.4M | Hit |
| AI-search fear on affiliate is overdone | Media +192.8%; owned audience ~180M users | Hit |
| Prediction markets are unpriced optionality | Polymarket and Kalshi both signed; already contributing to Q2 margin | Hit |
| Synergies 1 and 2 in motion re-rates the stock | Polymarket routes customer acquisition through Legend properties | Hit |
| Q2 is the first clean look; a beat is the trigger | Revenue $195.5M vs $185M; EBITDA $52.6M vs $45M; guidance raised | Hit |
| 269M diluted shares | ~311M fully diluted once warrants, RSUs and deal stock are counted | Wrong, corrected 4 Jul |
| GAAP profitability arrives in 2027 | Q2 loss of $77M; still the open item | Pending |
Eight of nine directional calls landed inside six weeks. The share count error was mine, it cut the DCF by roughly 16%, and it is the reason every per-share figure on this site now states its denominator.
What the quarter actually showed
Group revenue of $195.5M against a $185M guide, up 64.7%. Adjusted EBITDA of $52.6M against $45M, a 26.9% margin. Management raised full-year revenue to $1.005-1.025B and EBITDA to $285-295M, and guided Q3 to roughly $260M and $85M.
The margin beat matters more than the revenue beat. Management attributed it to three causes by name: early Legend synergies, execution across the combined Media business, and incremental contribution from prediction markets. That third item was described as free optionality in June and showed up as revenue in August.
What the street did with it
Four price target raises inside two days of the print, and the stock rose 12% on the combination of an upgrade and a target hike.
| Firm | Rating | Old PT | New PT |
|---|---|---|---|
| Needham | Buy | $12 | $13 |
| Guggenheim (Curry Baker) | Buy | $11 | $12 |
| Oppenheimer | Outperform | — | $12 |
| BTIG | Buy | $9 | $10 |
The cluster now sits at $10 to $13. My revised number is $15.41, which is above all of them, and the difference is almost entirely the prediction-market line. The sell-side is valuing the business it can model from disclosed segments. Polymarket and Kalshi have no disclosed economics yet, so a careful analyst leaves them at zero. I am carrying them at roughly a dollar a share.
The catalyst was spent before the print
A beat on every line, guidance raised twice over, four target hikes, and the stock fell 6% on the day it reported. The tape explains why.
| Date | Close | Change | Volume | Event |
|---|---|---|---|---|
| 3 Aug | $7.07 | +2.0% | 8.7M | quiet |
| 4 Aug | $8.08 | +14.3% | 16.8M | Polymarket agreement |
| 5 Aug | $8.33 | +3.1% | 16.0M | Kalshi agreement |
| 6 Aug | $7.83 | -6.0% | 12.4M | Q2 beat, guidance raised |
| 7 Aug | $7.59 | -3.1% | 9.3M | drift |
Volume on the 4th ran 3.1x the prior three-week average. The stock peaked on the 5th, the day before it reported anything. By the time the beat arrived, the buyers who wanted exposure to the prediction-market story had already taken it, and the print became an exit for anyone who had traded the announcements.
Ordering did the damage. Genius published Polymarket on Tuesday and Kalshi on Wednesday, which handed the market its two largest pieces of news 48 and 24 hours ahead of the results. The earnings release then had to compete with information the tape had already absorbed. A beat that lands into a stock up 18% over two sessions reads as confirmation rather than surprise.
The base underneath moved, which is the part that matters more than the drawdown. Before the announcements the stock traded $6.93 to $7.07. It now sits at $7.59, roughly 8% above that shelf, having given back the spike and stopped. My read is that the two agreements reset the floor rather than producing a spike to fade, and the coming weeks test whether $7.50 holds as support the way $6.00 did through June.
The 200-week line sits at $7.18. GENI closed the week 5.7% above it, trading above its own four-year average for the first time since the position was opened. The signal that started this analysis in February has now completed its round trip.
The line changed jobs
One number does two different jobs depending on which side of it the price sits, and GENI just moved from one to the other.
Below the line the 200-week average is a value instrument. Price under a four-year average means the market has revised its opinion downward, and the question it poses is whether that revision is correct. The discipline it demands is patience. You hold through drawdown because the thesis is reversion, and depth reads as opportunity.
Above the line the same number becomes a momentum instrument. It stops asking whether the market is wrong and starts marking whether the trend is intact. It converts from an entry trigger into trailing support, and the discipline inverts with it. Depth now reads as warning. A weekly close back below $7.18 becomes information rather than noise.
Crossing above has never been a sell signal in this framework, and the role change is the reason. Nothing about the business changed when the price passed $7.18 on the way up. What changed is the job the line performs. The number that said "look here" in February now says "the move that started in February is still standing."
GENI's own history sharpens the point. The previous episode below the line ran 157 weeks at 80.8% maximum depth and produced a 70% loss over the following year for anyone who bought the crossing. This one ran 27 weeks at 43.9%. A stock that historically took three years to climb back did it in six months.
| Episode below the line | Weeks | Max depth | Character |
|---|---|---|---|
| Nov 2021 to Nov 2024 | 157 | 80.8% | Business deteriorating |
| Feb 2026 to Aug 2026 | 27 | 43.9% | Business inflecting |
That contrast is the whole argument for doing the work behind the screen. Both episodes produced the same alert on the same indicator. The first one was a company losing its footing and the line was measuring decline. The second was a company acquiring Legend, signing two prediction markets and expanding margin 258bps past its own guide, where the line was measuring how far sentiment had fallen behind the business.
The dislocation let me buy that change at a discount. The dislocation did not create it. Six months of recovery against a prior three-year episode is what it looks like when the underlying business is doing the work rather than the mean.
Locke guides one set of numbers well and the other not at all
The forecasting record is worth separating into two lines, because they point opposite directions.
On revenue and adjusted EBITDA, Locke has been consistently conservative and beaten his own guide. Q2 came in 5.7% above the revenue guide and 17% above the EBITDA guide. FY2025 delivered 31% revenue growth with EBITDA up 59% and margin up 360bps, which is the margin expansion story arriving on schedule. Guidance has now been raised twice this year.
On GAAP net income, management has pointed at 2027 profitability for some time without guiding to it quarterly, and the line has moved the wrong way. The FY2024 net loss of $63.1M widened to $111.6M in FY2025. The first half of 2026 has already produced $132.5M of losses. Every one of those numbers has an explanation, and Q2's includes non-recurring deal costs. The pattern still reads as a company that forecasts its adjusted results with precision and lets the statutory result land where it lands.
That gap is the setup. Locke has earned credibility on the numbers he guides. He has not yet had to defend the number he does not. The quarter those two lines agree is a different kind of event than another EBITDA beat, and it is the one I am waiting on.
Backing Legend out of the Media line
Genius does not break out Legend. The segment arithmetic gets close enough to test the acquisition case.
Media reported $78.2M in Q2, up 192.8% year over year. That implies a base quarter of $26.7M. Legend closed 1 May, so the quarter contains two months of it.
The question is what Media would have earned without Legend. It grew 22% in Q1 2026, so I run the organic line at 20% to 25% and treat the residual as Legend.
| Organic Media growth assumed | Organic Q2 | Legend, 2 months | Legend annualized |
|---|---|---|---|
| 20% | $32.0M | $46.2M | $277M |
| 22% (Q1 actual) | $32.6M | $45.6M | $274M |
| 25% | $33.4M | $44.8M | $269M |
The estimate is stable across the range: Legend is running near $270-277M annualized. At acquisition I estimated $250-300M against a $1.2B price. The business is delivering at the upper half of that, which puts the purchase multiple around 4.4x revenue for an asset throwing off cash with capital-light economics.
The Q3 guide gives a second read. Guidance of $260M against $195.5M is a $64.5M sequential step. One additional month of Legend accounts for roughly $23M. The remaining $42M comes from NFL season, prediction markets, and organic growth in a quarter that has historically been the seasonal ramp.
The part that was supposed to take longer
The June piece listed four synergies and said none needed to contribute in 2026 for the thesis to work. Two are now visible. The Polymarket agreement has Genius driving Polymarket's expansion through Legend-owned media properties, which is cross-sell and audience monetization arriving together, in a contract, four months after close.
Management called the integration benefits "early." The 258bps of margin above guidance is what early looks like.
The advertisers, and the half of the year that matters
174 new advertisers in one quarter, before the season that carries the business.
Media buying is compounding on new logos
The Moment Engine added 174 new advertisers in Q2, including McDonald's, YouTube TV and DoorDash. Those brands came in around the World Cup, which functioned as a live trial with a global audience, and management reported strong results for them.
That is the second cohort effect in twelve months. Roughly 70 advertisers signed at the NewFront in Q1. Another 174 arrived in Q2. The pattern behind both is the same: an advertiser tests the product on one event, sees the measurement, and comes back with a bigger budget. Samsung is the documented version of that loop, grading the product Tier 1 internally and lifting spend 220% from test to booking.
Locke described two vectors into the NFL season. The first is that the 174 World Cup advertisers form a base to build from, since they have already run the product and seen it work. The second is the season itself, which is where American advertising budgets concentrate.
Media revenue reached $78.2M in the quarter against an owned audience of roughly 180 million users from Legend. The advertiser count and the audience are separate levers on the same line, and neither has been through an NFL season together.
Genius earns its year in the second half
Q2 is the seasonal trough. Management said as much about cash, calling it the low point on seasonality and one-time acquisition costs, and guided roughly $100M of cash flow across H2.
The revenue shape is more dramatic than the commentary suggests. Working from the raised full-year guidance and the Q3 guide, the implied Q4 is $371.5M against $195.5M in Q2.
| Half | Revenue | Adj. EBITDA | Margin |
|---|---|---|---|
| H1 2026 actual | $383.5M | $76.6M | 20.0% |
| H2 2026 implied | $631.5M | $213.4M | 33.8% |
Roughly 62% of the year's revenue and 74% of its EBITDA arrive after 30 June. The NFL season, the Moment Engine's advertiser base, three full months of Legend, and the first prediction-market revenue all land in the same two quarters. The business as reported through June is the version of Genius that operates in its off-season.
Where you can actually see the technology
I went looking for the products in the wild and found the same confusion worth writing down: the visible sports-data layer on any given screen usually belongs to whoever holds that league's rights, and those split cleanly between the two vendors.
Live baseball play-by-play feeding betting platforms is Sportradar's, under an exclusive MLB partnership running through 2032. Genius holds no MLB rights. So the baseball data on a sportsbook or a scoreboard app is the competitor's product, and Polymarket's MLB markets settle on it.
Genius shows up in different places:
| Product | Where it appears | Sport |
|---|---|---|
| BetVision (touch-to-bet, live minimap, player tags) | DraftKings, FanDuel, Caesars in-app streams | NFL, soccer, tennis |
| SAOT offside graphics | Premier League, Serie A and Brazilian Serie A broadcasts | Soccer |
| Augmented in-broadcast advertising | NBC Sports regional networks, 600+ NBA games | Basketball |
| Exclusive streaming beside contracts | Polymarket US, live since 4 Aug | Serie A and selected competitions |
GAAP positivity is the gate
The platform works. The income statement is what keeps the multiple down.
Q2 posted a net loss of $77M, which the company attributes primarily to non-recurring transaction expenses from the Legend deal. First half loss stands at $132.5M against $55.5M in Q1.
The structural issue sits between adjusted EBITDA and net income. In FY2025 that gap ran $248M: depreciation and amortization on capitalized data rights, share-based compensation, and interest. Legend adds intangible amortization on top, and the $825M term loan costs $60-65M a year in interest.
| Period | Adj. EBITDA | Net income | Gap |
|---|---|---|---|
| FY2025 | $136.2M | -$111.6M | $248M |
| Q1 2026 | $24M | -$55.5M | $80M |
| Q2 2026 | $52.6M | -$77M | $130M (incl. deal costs) |
| Q3 2026 guide | $85M | see below | ~$70-80M est. |
Run the arithmetic forward. Q3 guides to $85M of adjusted EBITDA. Against a normalized quarterly gap of $70-80M, once transaction costs stop repeating, that lands between breakeven and $15M of net income. Q4 is the seasonal peak and should carry more.
My call: the first GAAP-positive quarter arrives in Q3 or Q4 2026. Full-year 2026 stays negative because the first half already spent $132.5M. Full-year 2027 is the first positive year, which is what management has guided and what the $0.34 consensus implies: about $106M of net income on 311M shares.
Why this is the thing holding the stock
At $7.59 the enterprise value is $3.11B, which is 10.7x this year's EBITDA guidance for a business compounding revenue above 30%. That multiple is not an argument about the platform. It is a description of who is allowed to own the stock.
Index construction, institutional mandates, and most quantitative screens key off GAAP earnings. A company with negative net income fails those filters no matter what its adjusted numbers say. The buyer base stays retail and specialist until a positive quarter prints, at which point the stock becomes eligible for capital that has never looked at it.
That is the re-rate mechanism. Not a new product, not another league. A quarterly income statement with a positive number at the bottom, followed by an annual one.
Who currently owns this, and who is not allowed to
The ownership table explains the volatility better than any thesis does.
| Holder type | Share |
|---|---|
| Institutions | 82.0% |
| Insiders | 9.1% |
| Everyone else | ~8.9% |
| Short interest, as % of float | 13.5% |
Roughly 91% of the company is held by institutions and insiders, and 13.5% of the float is sold short. That is the profile of a contested position held by funds that can underwrite a loss-making balance sheet: event-driven money, credit-aware money, and the shorts taking the other side of the leverage argument. Long-only retail and traditional institutions are largely absent, and they are absent for a structural reason rather than a lack of interest.
A company with negative GAAP earnings has no price-to-earnings ratio. It does not appear in any screen with a P/E filter, which is most of them. Many long-only mandates carry explicit restrictions on unprofitable holdings, quality and GARP strategies gate on profitability outright, and a great deal of retail-facing research tooling simply renders a blank field where the multiple should be. None of that is a judgment about Genius. It is a filter running on a null value.
A GAAP-positive quarter populates that field. The stock becomes visible to screens it has never appeared in, eligible for mandates that currently exclude it, and comparable on a metric the market actually uses. At the same time the primary bear argument, that this is a levered business that does not earn money, stops being literally true with 13.5% of the float positioned against it.
That combination is why I think the re-rate is discontinuous rather than gradual. The buyer base does not widen slowly as margins improve. It widens on the date a number crosses zero.
Pricing the prediction-market business
Two agreements in 48 hours, both landing before the print.
On 4 August, Polymarket. On 5 August, Kalshi. Together they are the two largest prediction markets in the world, and both are now Genius customers.
The Polymarket agreement is wider than a data feed. It covers exclusive live streaming rights and league IP across selected competitions, including Serie A in the United States; official data used to settle contracts; integrity information-sharing that gives leagues visibility into trading around their own competitions; and Genius driving Polymarket's growth through Legend-owned media properties.
That last piece is the one to sit with. Genius supplies the data that settles the contract, the stream the customer watches, the integrity layer the league requires, and the marketing channel that acquired the customer. Four revenue lines into one counterparty, which is the Liga MX pattern applied to a category that did not exist as a customer segment two years ago.
What it is worth
Locke has framed each major prediction market as similar in scale to a top US sportsbook. Genius serves roughly 500 sportsbooks, and the largest relationships are worth tens of millions a year each. Two counterparties at that scale, with four revenue lines rather than one, gives a range.
| Scenario | PM revenue | Margin | Multiple | Per share |
|---|---|---|---|---|
| Conservative | $40M | 50% | 10x | +$0.64 |
| Base | $60M | 50% | 12x | +$1.16 |
| Scaled | $90M | 55% | 14x | +$2.23 |
I use the base case. It assumes the two platforms together reach roughly the scale of one large sportsbook relationship expressed across four revenue lines, at Media-like incremental margins, valued below where the core business should trade.
Revised target
Raised guidance, contracted optionality, unchanged share count.
The June DCF produced roughly $15 per share on 311M fully diluted shares, using $1.0B of 2026 revenue and a 28% margin. Guidance now runs $1.005-1.025B and 28.6%, so the core model improves modestly to $14.25. Adding the base-case prediction-market line, which was excluded from the original model entirely, takes it to $15.41.
| Component | Per share |
|---|---|
| Core DCF, 12% WACC, 3% terminal, 311M shares | $14.25 |
| Prediction markets, base case | +$1.16 |
| Revised base target | $15.41 |
| Price at this writing | $7.59 |
| Implied upside | +103% |
The headline number barely moved. What changed is the confidence interval around it. In June the case required believing that Legend would integrate, that margins would expand, and that prediction markets might eventually matter. All three have now happened in public, which removes execution discount rather than adding growth.
Scenario ladder
| Scenario | Implied | Path |
|---|---|---|
| Bear | ~$6 | GAAP breakeven slips past 2027, affiliate traffic decays, multiple stays at 10x |
| Base | ~$15.40 | Q4 prints GAAP positive, PM scales to $60M, multiple normalizes toward peer |
| Bull | ~$19+ | PM at $90M, 2027 EPS beats $0.34, index eligibility brings new buyers |
What I am watching
The Q3 print in early November is the next real checkpoint, and it carries three tests: whether the income statement turns positive without transaction-cost noise, whether three full months of Legend confirm the $274M run rate, and whether prediction-market revenue gets broken out or quantified on the call.
The position is unchanged through the print.
What I hold
Stated in full so the argument above can be read against the interest behind it. Entry prices and sizing rationale sit in The Book.
| Instrument | Size | Role |
|---|---|---|
| GENI common stock | 1,750 shares | Long-term core |
| Call, $7.50 strike, Oct 2026 | 20 contracts | Built for this print |
| Call, $10.00 strike, Jan 2027 | 25 contracts | Street-target strike |
| Call, $12.50 strike, Jan 2027 | 20 contracts | Full re-rate convexity |
| Call, $5.00 strike, Jan 2028 | 10 contracts | Stock replacement, long runway |
The October calls were bought for exactly this quarter and the 2027 and 2028 legs carry the recognition thesis, which needs the GAAP gate to open before the multiple moves. I am long and I am talking my book. Read the bear case in the original piece and the invalidation below with that in mind.
Godel Terminal
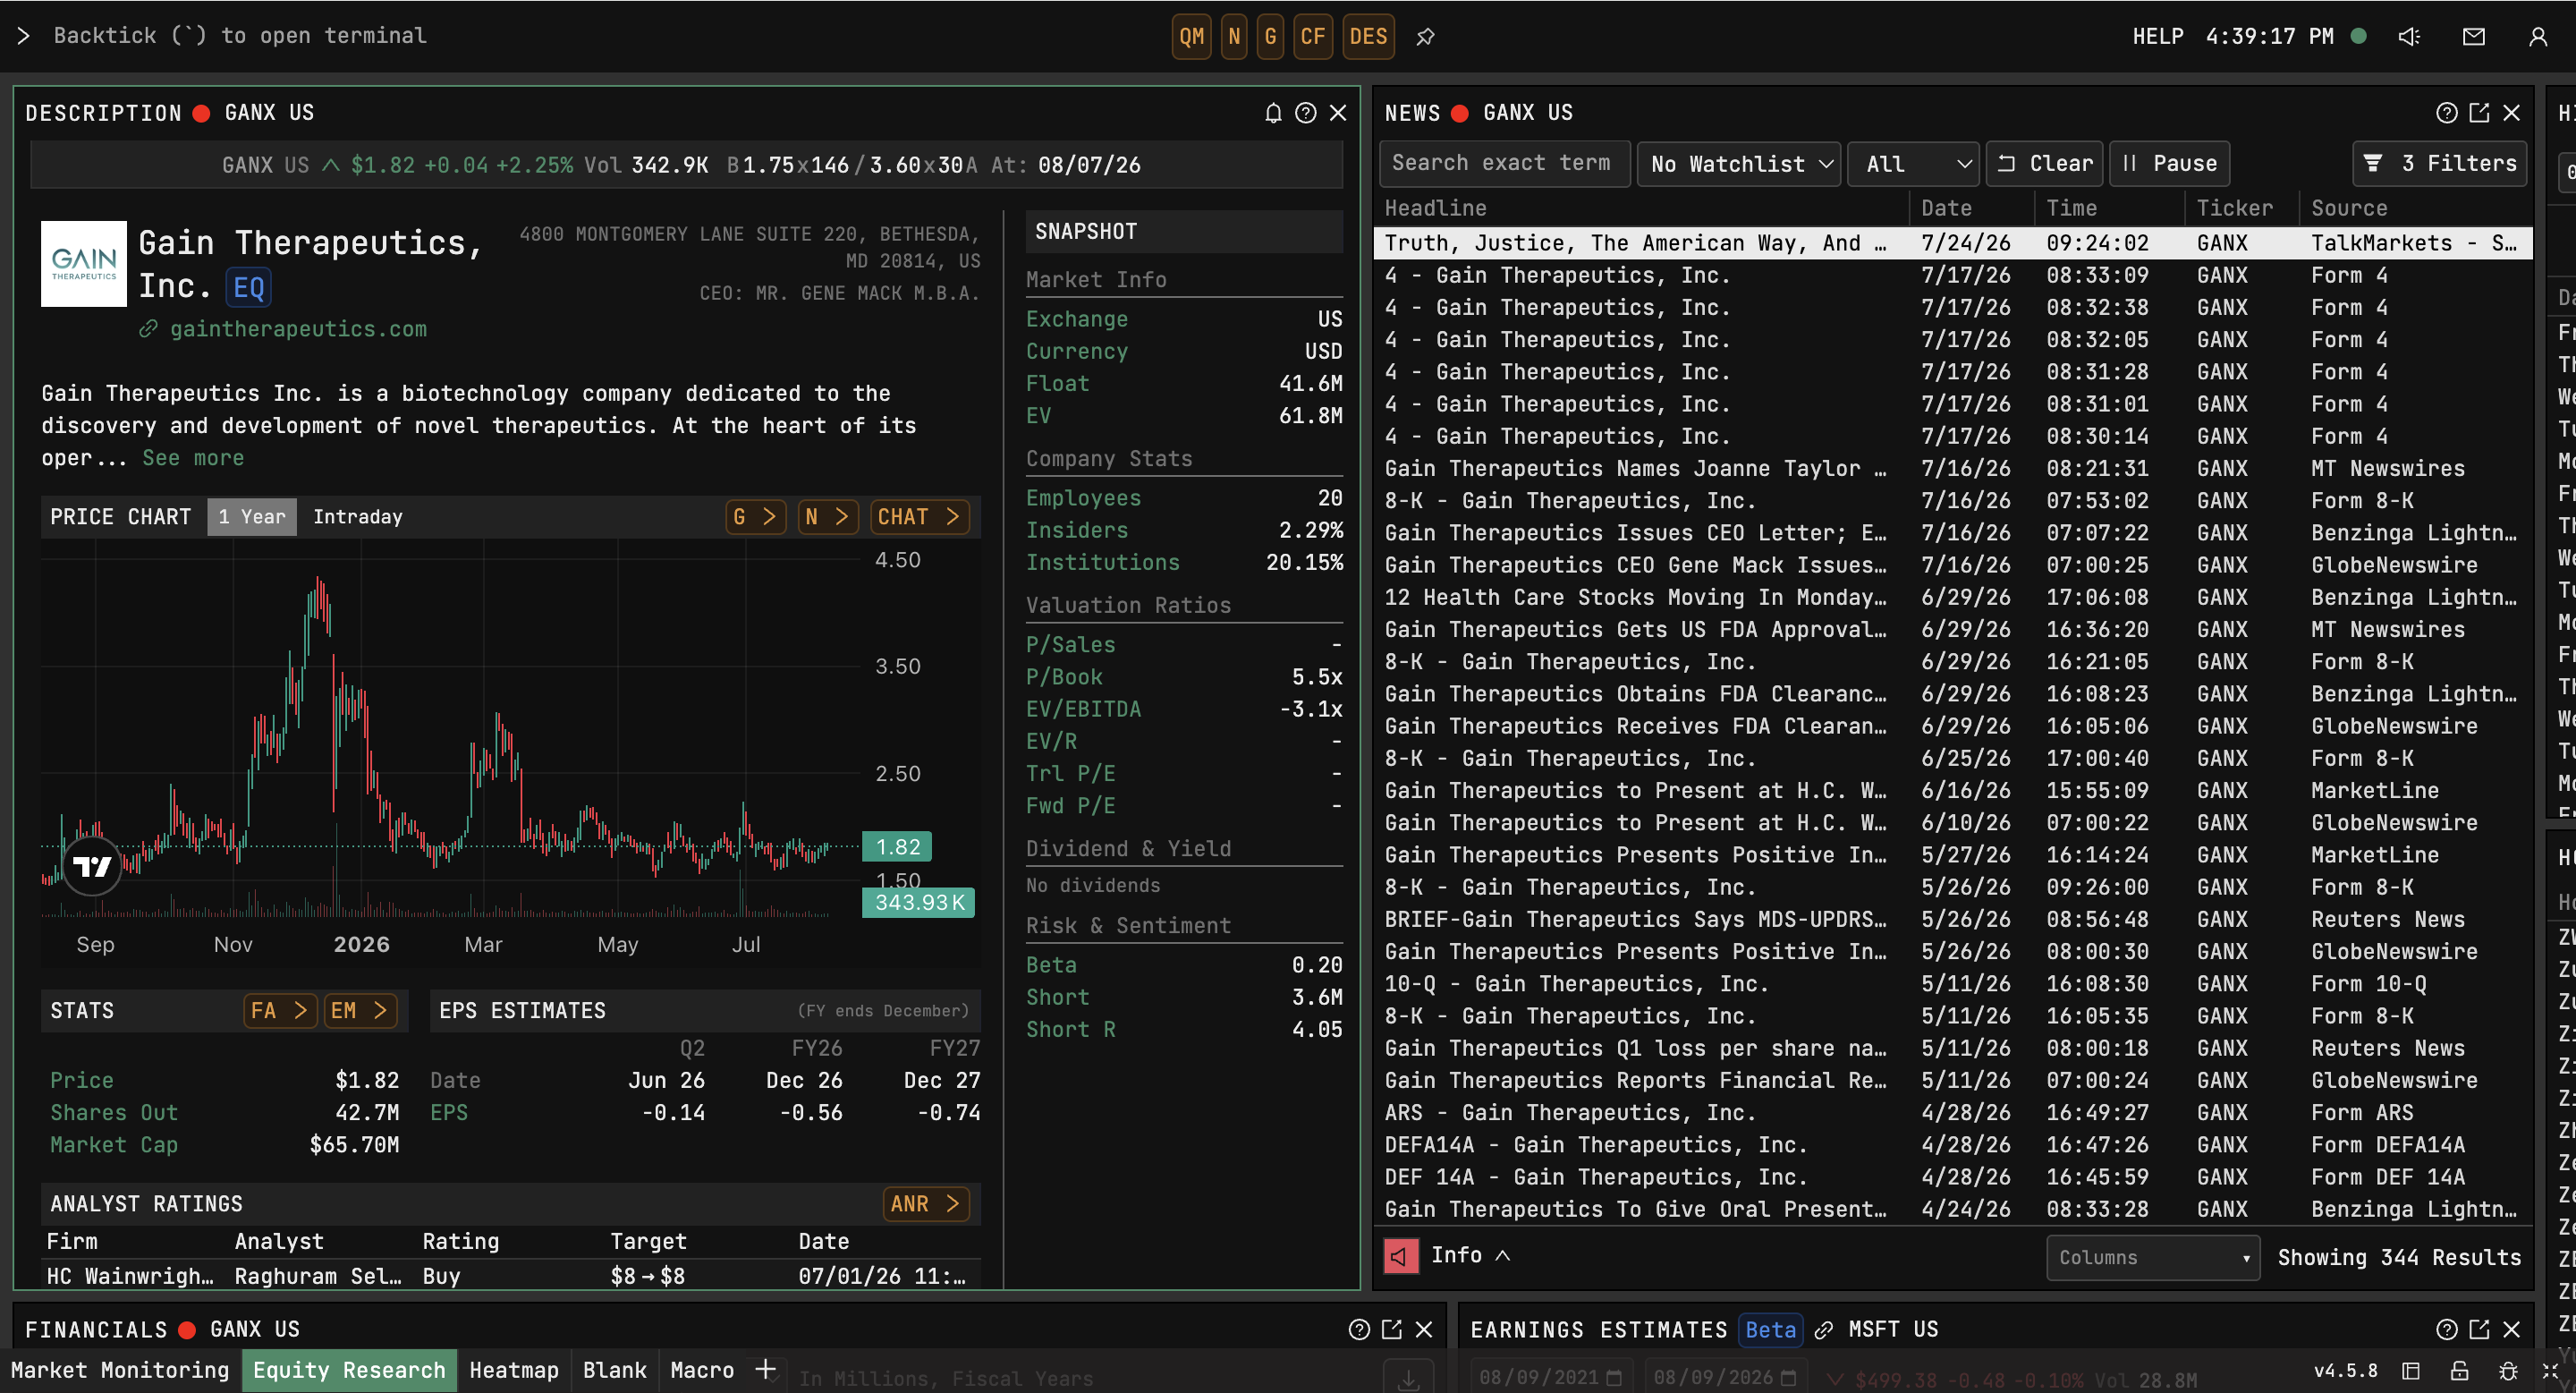
A browser-based research terminal with a Bloomberg-style command interface: DES, FOCUS, TAS, HDS. Real-time quotes, filings, financials, ownership and news, at $996 a year against Bloomberg's roughly $27,000.
The filing and ownership work behind this piece ran through it. Research and analysis only; order execution and dealer chat are not in it, so it sits alongside a broker rather than replacing one. Fourteen-day trial.
Disclosure: this is a referral link and mungbeans.io earns a commission if you subscribe, at no extra cost to you. The discount code is why it is here; the recommendation is because I pay for it myself. This is the only paid link on the site, and the site carries no advertising.